
Optimizing Memory Handling Using Visual Studio Profilers
In the world of software development, memory management plays a critical role in the performance and stability of applications. For .NET developers, understanding and optimizing how an application handles memory is not just an optional task – it’s a necessity. This blog delves into the importance of memory profiling, the tools available in Visual Studio, and key strategies for effectively managing memory in .NET applications.
Mishandling Memory Issues
Memory-related issues can appear in various forms, ranging from gradual performance degradation to sudden application crashes. Common problems include:
- Memory Leaks: Occur when an application fails to release memory that is no longer needed, causing memory usage to grow over time and eventually exhausting system resources.
- Increased Latency: As the system struggles to manage the growing memory footprint, operations and response times slow down.
- Excessive Garbage Collection: Poor memory management can lead to the system spending more time cleaning up unused memory, further degrading performance.
- Application Crashes or Unresponsiveness: In extreme cases, unmanaged memory issues can cause an application to crash or become unresponsive.
Why Memory Profiling Matters
Comprehensive analysis of memory management helps developers pinpoint areas where it can be improved, ensuring the efficient use of resources and better overall application performance. Memory profiling offers several key benefits, including:
- Improving Scalability: Allows applications to handle larger workloads and scale effectively by ensuring that memory usage is optimized.
- Reducing Costs: In cloud environments, optimized memory usage can lower costs by reducing the need for additional resources.
- Ensuring Better User Experience: By maintaining optimal memory performance, applications run smoother, providing a more reliable and responsive experience for users.
Memory Profiling in Visual Studio
Visual Studio provides a comprehensive interface for memory profiling, offering developers two primary options for analyzing memory usage. The standalone Performance Profiler tool suite enables detailed analysis, while the debugger-integrated Diagnostics Tools allow for controlled application execution, facilitating the investigation and resolution of performance issues in real-time. For .NET developers, memory profiling can be conducted using either the .NET Object Allocation tool or the Memory Usage tool, depending on the specific requirements of the analysis.
.NET Object Allocation Tool – Key Features
Once the application is running, the .NET Object Allocation tool provides several key insights into how memory is being allocated and utilized:
- Allocation Patterns:
- How to Access: Access the Allocations view to view the location of objects that are allocating memory and how much memory those objects are allocating.
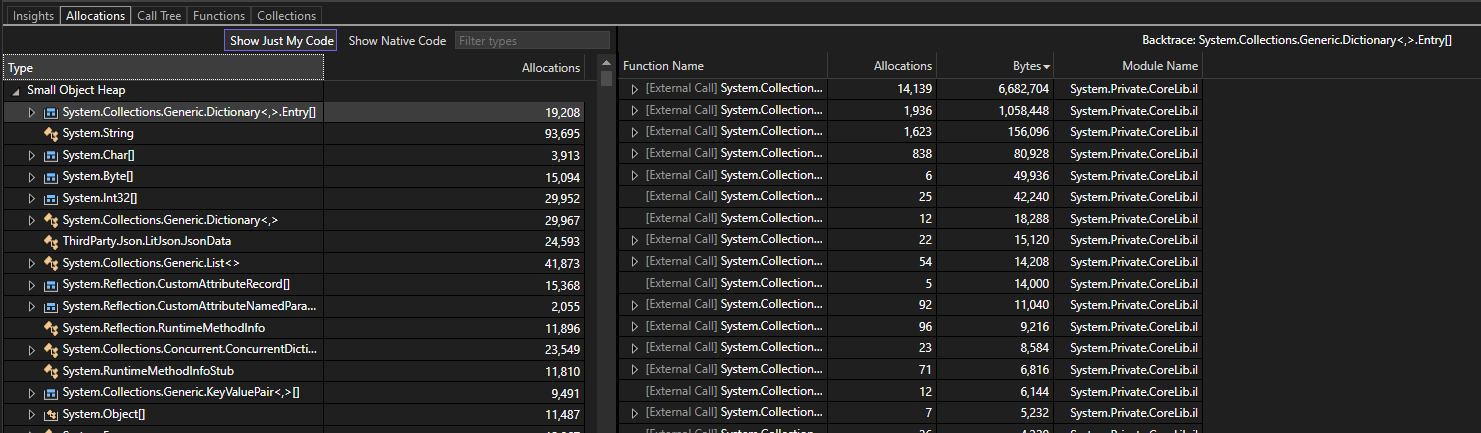
- What It Shows: The tool displays detailed information about how frequently objects are being allocated, as well as the memory footprint of these allocations.
- Garbage Collection Analysis:
- How to Access: Access the Collections view to view how many objects were collected during garbage collection.
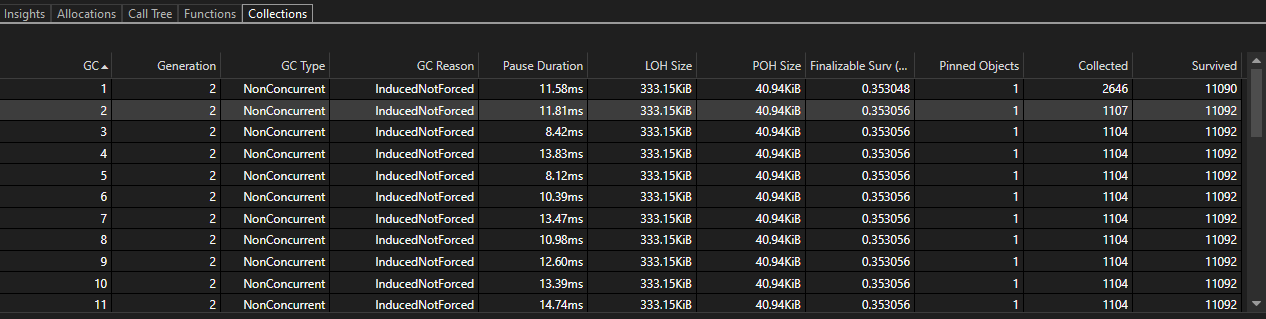
- What It Shows: The tool highlights objects that are contributing to frequent garbage collection, which can degrade performance if not managed properly.
- Large Object Heap (LOH) Analysis:
- How to Access: The .NET Object Allocation tool can help identify allocations that go directly to the Large Object Heap, typically for objects larger than 85,000 bytes. This is shown in the detailed analysis of the Allocations view.
- What It Shows: The tool displays large object allocations and their impact on memory fragmentation and garbage collection.
Memory Usage Tool – Key Features
Once the application is running, the Memory Usage tool provides several key insights:
- Heap Size:
- How to Access: Monitor the heap size via the live graph displayed in the Memory Usage tab
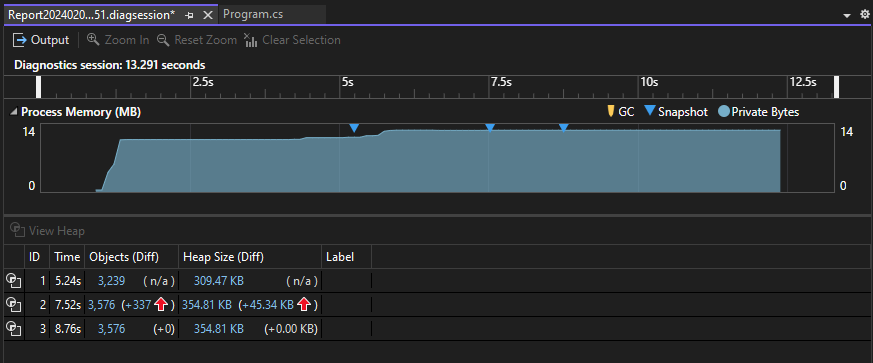
- What It Shows: The graph provides a visual representation of your application’s memory consumption over time. An increasing trend could indicate a memory leak or inefficient memory usage. Use this data to take snapshots at critical points in your application’s lifecycle to compare memory usage and identify persistent objects that are not being released.
- Memory Snapshots:
- How to Access: During profiling, you can take memory snapshots by clicking the “Take Snapshot” button.
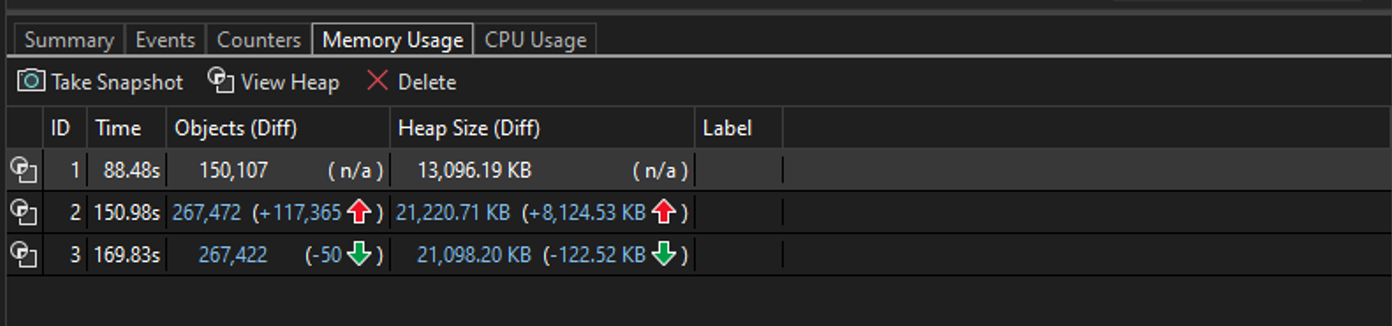
- What It Shows: Snapshots capture the state of the application’s memory at a specific point in time, allowing for comparison of memory usage across different snapshots. This comparison is crucial for detecting memory leaks, as it shows which objects are not being properly disposed of.
Key Areas to Focus On: Examples Using Memory Usage and .NET Object Allocation Tools
Memory profiling provides invaluable data that can help developers optimize their applications by revealing inefficiencies and areas where memory management can be improved. Once the profiling data is gathered using tools like the .NET Object Allocation tool and the Memory Usage tool in Visual Studio, the next step is to analyze this data and take actionable steps to optimize memory usage.
Here are some key areas to focus on to effectively utilize profiling data to enhance memory management.
High Allocation Rates
- What to Look For:
- Memory Usage Tool: Monitor the Objects section to see which objects are being allocated most frequently. High allocation rates might show up as a large number of instances of specific objects being created over short periods.
- .NET Object Allocation Tool: Use Allocations and Functions view to examine detailed allocation patterns, where you can see the frequency of object allocations.
- Optimization Strategy: Optimize by reusing objects through object pooling or reducing the frequency of allocations by modifying algorithms or data structures.
Large Object Heap (LOH) Usage
- What to Look For:
- Memory Usage Tool: Track the overall Heap Size and look for spikes in the pool view that correspond to allocations over 85,000 bytes, which go to the Large Object Heap. The tool can show you which objects are contributing to this increase.
- .NET Object Allocation Tool: Use this tool to identify large objects being allocated. For example, you might see that a large array or data structure is frequently allocated, leading to LOH fragmentation.
- Optimization Strategy: Break down large objects into smaller ones where possible, or use object pooling to minimize LOH allocations.
Memory Leaks
- What to Look For: Memory Usage Tool: Observe the Heap Size over time. If the heap size consistently increases without going down, even during periods of low activity, this could indicate a memory leak. Use memory snapshots to compare and identify objects that persist longer than expected.
- .NET Object Allocation Tool: This tool helps you spot objects that should have been garbage collected but are still being held in memory.
- Optimization Strategy: Ensure that objects are properly disposed of when they are no longer needed, particularly those that implement I Disposable. Ensure that event handlers are properly unsubscribed when no longer needed to allow the garbage collector to free up memory.
Garbage Collection Frequency
- What to Look For: Memory Usage Tool: Look at the Collections view. The tool provides insights into how often garbage collection occurs. Frequent collections, especially Generation 2 collections, can indicate that the application is allocating and releasing objects too quickly.
- .NET Object Allocation Tool: Use this tool to analyze the types and sizes of objects that trigger garbage collection. For example, you might see that many small objects are causing frequent Generation 0 collections.
- Optimization Strategy: Reduce unnecessary allocations and avoid allocating large numbers of small objects. Consider using more efficient data structures that minimize memory churn.
Long-Lived Objects
- What to Look For: Memory Usage Tool: Use memory snapshots to identify objects that remain in memory over extended periods. The tool helps you track which objects are retained in the heap and contribute to long-lived memory usage.
- .NET Object Allocation Tool: This tool allows you to trace objects back to their allocation sites and understand why they are still in memory, in the details Allocations. For example, you might see that a large collection is retaining references to objects that are no longer needed.
- Optimization Strategy: Review the code to ensure that objects are removed from collections or released when they are no longer needed. Review the lifespan of objects, especially those stored in static fields or long-lived collections.
Inefficient Data Structures
- What to Look For: Memory Usage Tool: Analyze memory snapshots to see the memory footprint of different data structures. The tool can help you identify if certain collections or objects are consuming more memory than expected.
- .NET Object Allocation Tool: Examine how often certain data structures are allocated and the amount of memory they consume.
- Optimization Strategy: Replace inefficient data structures with more memory-friendly alternatives. For example, consider Dictionary<TKey, TValue> for faster lookups with a smaller memory footprint.
Conclusion
Memory profiling is an essential practice for any .NET developer looking to build high-performance, stable applications. Visual Studio’s memory profiling tools provide deep insights into your application’s memory usage, helping you identify and resolve issues before they impact your users.
By following the steps outlined in this guide, you can take action to optimize memory usage, leading to better performance and a smoother user experience. Happy profiling!
Further Reading
Microsoft. Profiling Tools in Visual Studio. Microsoft Learn. Retrieved from https://learn.microsoft.com/en-us/visualstudio/profiling/?view=vs-2022